Doge
Dogecoin (DOGE) Momentum Builds as Bulls Target $0.21 Zone
Dogecoin trades near $0.182 after a 10% weekly rise. Traders track bullish MACD, pattern breakouts, and a potential move toward $0.21. Dogecoin is trading near $0.182 after gaining close to 10% over the past week. Price action and momentum indicators across several timeframes are showing signs of strength. Consequently, traders are watching for confirmation of…
Dogecoin trades near $0.182 after a 10% weekly rise. Traders track bullish MACD, pattern breakouts, and a potential move toward $0.21.
Dogecoin is trading near $0.182 after gaining close to 10% over the past week. Price action and momentum indicators across several timeframes are showing signs of strength.
Consequently, traders are watching for confirmation of a trend shift as DOGE holds above key support levels.
Momentum Builds on Daily Chart
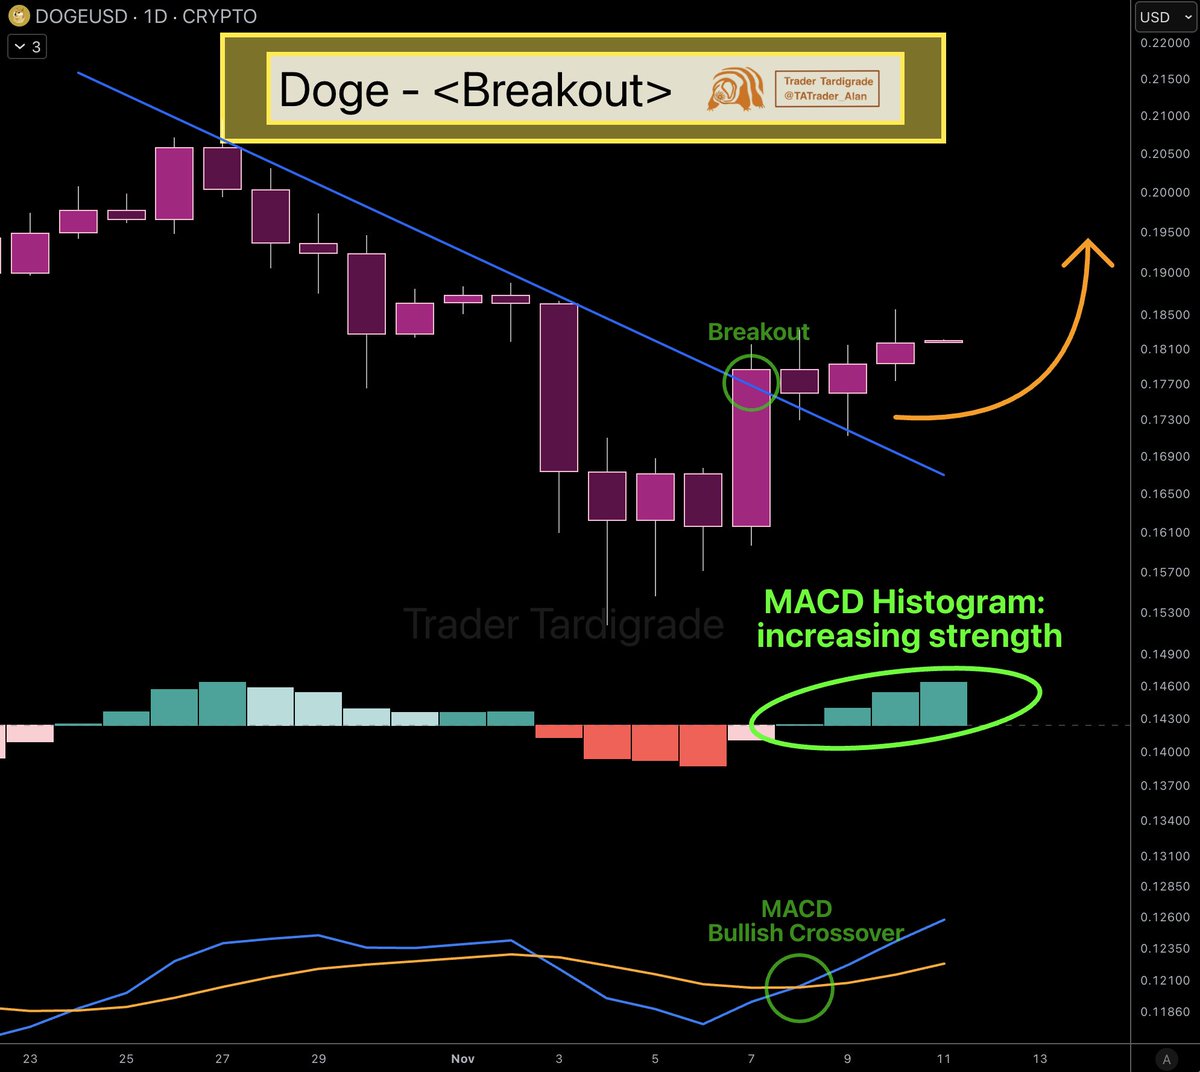
On the daily chart, the OG meme coin broke above a descending trendline after a stretch of lower highs and lows. The MACD indicator has flipped bullish with the MACD line crossing above the signal line. This was followed by rising histogram bars, pointing to increasing momentum.
Trader Tardigrade shared the chart and noted,
“MACD histogram shows continuous increase in strength.”
Bullish Patterns Emerging on DOGE Charts
An inverse Head and Shoulders pattern has formed on the 4-hour chart. The breakout above the neckline occurred on November 10, followed by a retest that held above $0.18. The asset has since remained above that level.
This setup includes a left shoulder, head, and right shoulder, followed by a breakout. Trader Tardigrade confirmed the structure and said DOGE had “successfully completed a retest” after the breakout.
Moreover, the 12-hour chart shows a Cup and Handle formation. The cup formed during a rounded bottom, followed by a short pullback creating the handle. DOGE broke through the horizontal resistance line and is now trading near $0.184.
You may also like:
-
12 Best Meme Coins to Watch in July 2025 -
Dogecoin (DOGE) Rally Lacks Retail Mania – And That Might Be Bullish -
Major Crypto Unlock for this Week: SOL, AVAX, and DOGE Face $790M Supply Surge
The estimated move from the pattern points toward a target near $0.211. Tardigrade called attention to this level after the breakout was confirmed.
$Doge/12-hour#Dogecoin Cup and Handle breakout, target at $0.211 🔥 https://t.co/EcfvBaerRr pic.twitter.com/qTco9xtfMp
— Trader Tardigrade (@TATrader_Alan) November 11, 2025
Traders Watch Key Levels
BitGuru said DOGE shifted out of a downtrend and is testing a resistance zone.
“If it breaks above this zone, continuation upward is likely,” the post said.
Binance data from CW shows top traders remain long, with DOGE positions holding at 77.82%.
Market Prophit posted that crowd sentiment and model sentiment remain “Bullish.” DOGE traded between $0.177 and $0.184 during Tuesday’s session, with buyers defending the $0.1800 level. Price tested the upper end of the range before pulling back slightly.
As CryptoPotato reported, the Bitwise spot DOGE ETF is currently under a 20-day countdown for automatic approval. If approved, it would mark the first DOGE-based ETF on the US market.
SECRET PARTNERSHIP BONUS for CryptoPotato readers: Use this link to register and unlock $1,500 in exclusive BingX Exchange rewards (limited time offer).


Doge
1,000,000,000 DOGE in 7 Days: Could Dogecoin’s Bear Market Be Starting?
Here’s why DOGE may experience an additional 30% price crash. The biggest meme coin is among the worst-affected cryptocurrencies from the broader market correction, with its price crashing by 17% over the past week. The recent whale sell-off could have also negatively impacted Dogecoin. Selling en Masse The renowned analyst, using the X handle Ali…
Here’s why DOGE may experience an additional 30% price crash.
The biggest meme coin is among the worst-affected cryptocurrencies from the broader market correction, with its price crashing by 17% over the past week.
The recent whale sell-off could have also negatively impacted Dogecoin.
Selling en Masse
The renowned analyst, using the X handle Ali Martinez, revealed that large Dogecoin investors have dumped more than one billion tokens in the last week alone. The stash equals approximately $165 million (calculated at current rates). Following that move, this cohort of investors now holds less than 23 billion DOGE, representing around 15% of the asset’s circulating supply.
Efforts of that type are generally seen as bearish since they increase the amount of coins on the market, and that could be followed by a price pullback (assuming demand doesn’t react accordingly). The massive sell-off may also spread panic across the community and prompt smaller players to cash out, too.
Shortly after, Martinez touched upon Dogecoin again. He said the OG meme coin has been trading within a rising channel since March, but recently broke below the bottom of that structure at $0.18. This means that DOGE has lost support and could be headed for a more violent crash, potentially dropping as low as $0.11.
The Bullish Scenario
Despite the downtrend, some market observers remain optimistic that not all is lost for Dogecoin for this cycle. X user Chandler reminded that November has been a strong month for the meme coin in recent years, predicting that history might repeat itself.
Elon Musk also infused some positivism. The world’s wealthiest man (who happens to be a firm proponent of DOGE) said in 2021 that SpaceX “is going to put a literal Dogecoin on the literal Moon.” Several hours ago, he referred to that tweet, stating, “It’s time,” but also placed a laughing emoji at the end.
You may also like:
-
Dogecoin (DOGE) Rally Lacks Retail Mania – And That Might Be Bullish -
Major Crypto Unlock for this Week: SOL, AVAX, and DOGE Face $790M Supply Surge -
12 Best Meme Coins to Watch in July 2025
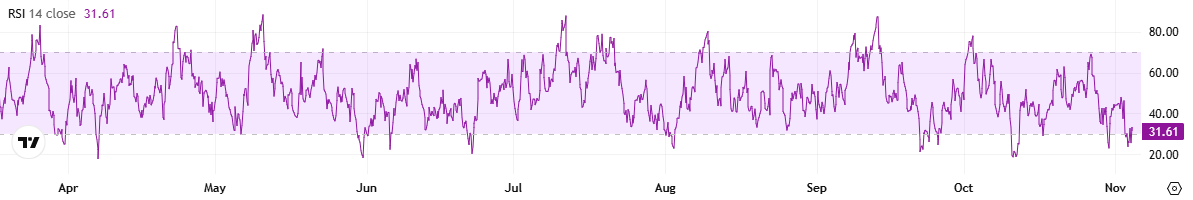
Meanwhile, DOGE’s Relative Strength Index (RSI) indicates that a rebound could be incoming. The technical analysis tool measures the speed and magnitude of recent price changes, helping traders assess potential reversal points. It ranges from 0 to 100, and ratios below 30 are interpreted as bullish, as they suggest DOGE might be oversold. Currently, the RSI hovers around that mark.
SECRET PARTNERSHIP BONUS for CryptoPotato readers: Use this link to register and unlock $1,500 in exclusive BingX Exchange rewards (limited time offer).
Doge
Dogecoin Dips Under Key Support – Yet a Breakout Pattern Is Forming
Dogecoin drops 14% in a week amid whale selling and weak momentum, but analysts spot a wedge pattern that previously led to a breakout. Dogecoin has come under pressure, falling more than 6% in the past 24 hours and over 14% in the last week. As of press time, it is trading near $0.174. The…
Dogecoin drops 14% in a week amid whale selling and weak momentum, but analysts spot a wedge pattern that previously led to a breakout.
Dogecoin has come under pressure, falling more than 6% in the past 24 hours and over 14% in the last week.
As of press time, it is trading near $0.174. The drop is part of a broader market pullback.
Technical Setup Shows Familiar Pattern
Trader Tardigrade, a crypto chart analyst, has pointed out a recurring formation on Dogecoin’s daily chart. The pattern is known as a descending contracting wedge. It is taking shape with three clear touches on the lower support line and two touches on the upper resistance line. This same setup appeared on the chart in August and led to a sharp move upward after the breakout.
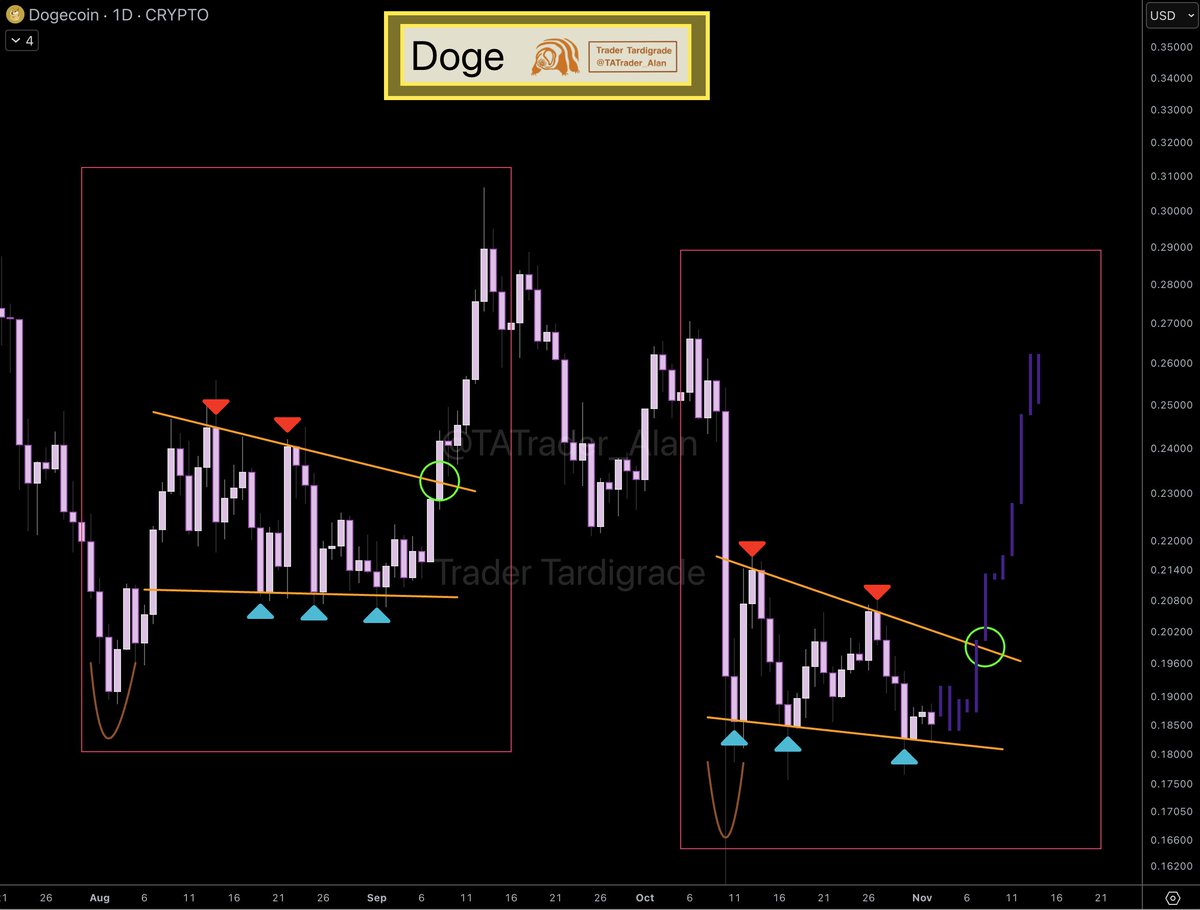
The current wedge, formed between October and early November, closely matches the earlier pattern. A breakout from the resistance line has already occurred, marked by a green circle on the chart shared by Tardigrade. If the past price movement repeats, Dogecoin could see a short-term rise toward the $0.26 to $0.28 range. The structure alone, however, does not confirm direction. It will depend on volume and trader participation.
In addition to the daily chart, Tardigrade also shared a broader monthly view. Dogecoin appears to be forming a long-term rounding bottom pattern. Based on the chart’s depth, this setup could project a move toward $4.14. This structure reflects price behavior over a much more extended period and does not suggest any immediate shift.
Moreover, another key formation can be seen on the 3-day chart, where Dogecoin is trading inside a wide ascending channel. The asset is now near the bottom of that channel, which has previously acted as support.
$Doge/3-day#Dogecoin has been moving within a large Ascending Channel.
It’s currently positioned at the bottom of the channel 👀 pic.twitter.com/lkSB3ChbLd— Trader Tardigrade (@TATrader_Alan) November 3, 2025
You may also like:
-
Dogecoin (DOGE) Rally Lacks Retail Mania – And That Might Be Bullish -
Major Crypto Unlock for this Week: SOL, AVAX, and DOGE Face $790M Supply Surge -
12 Best Meme Coins to Watch in July 2025
Indicators Reflect Weak Momentum
The Relative Strength Index (RSI) on the daily chart is now at 35. While not yet oversold, it is approaching levels that may cause short-term price stabilization or a bounce.
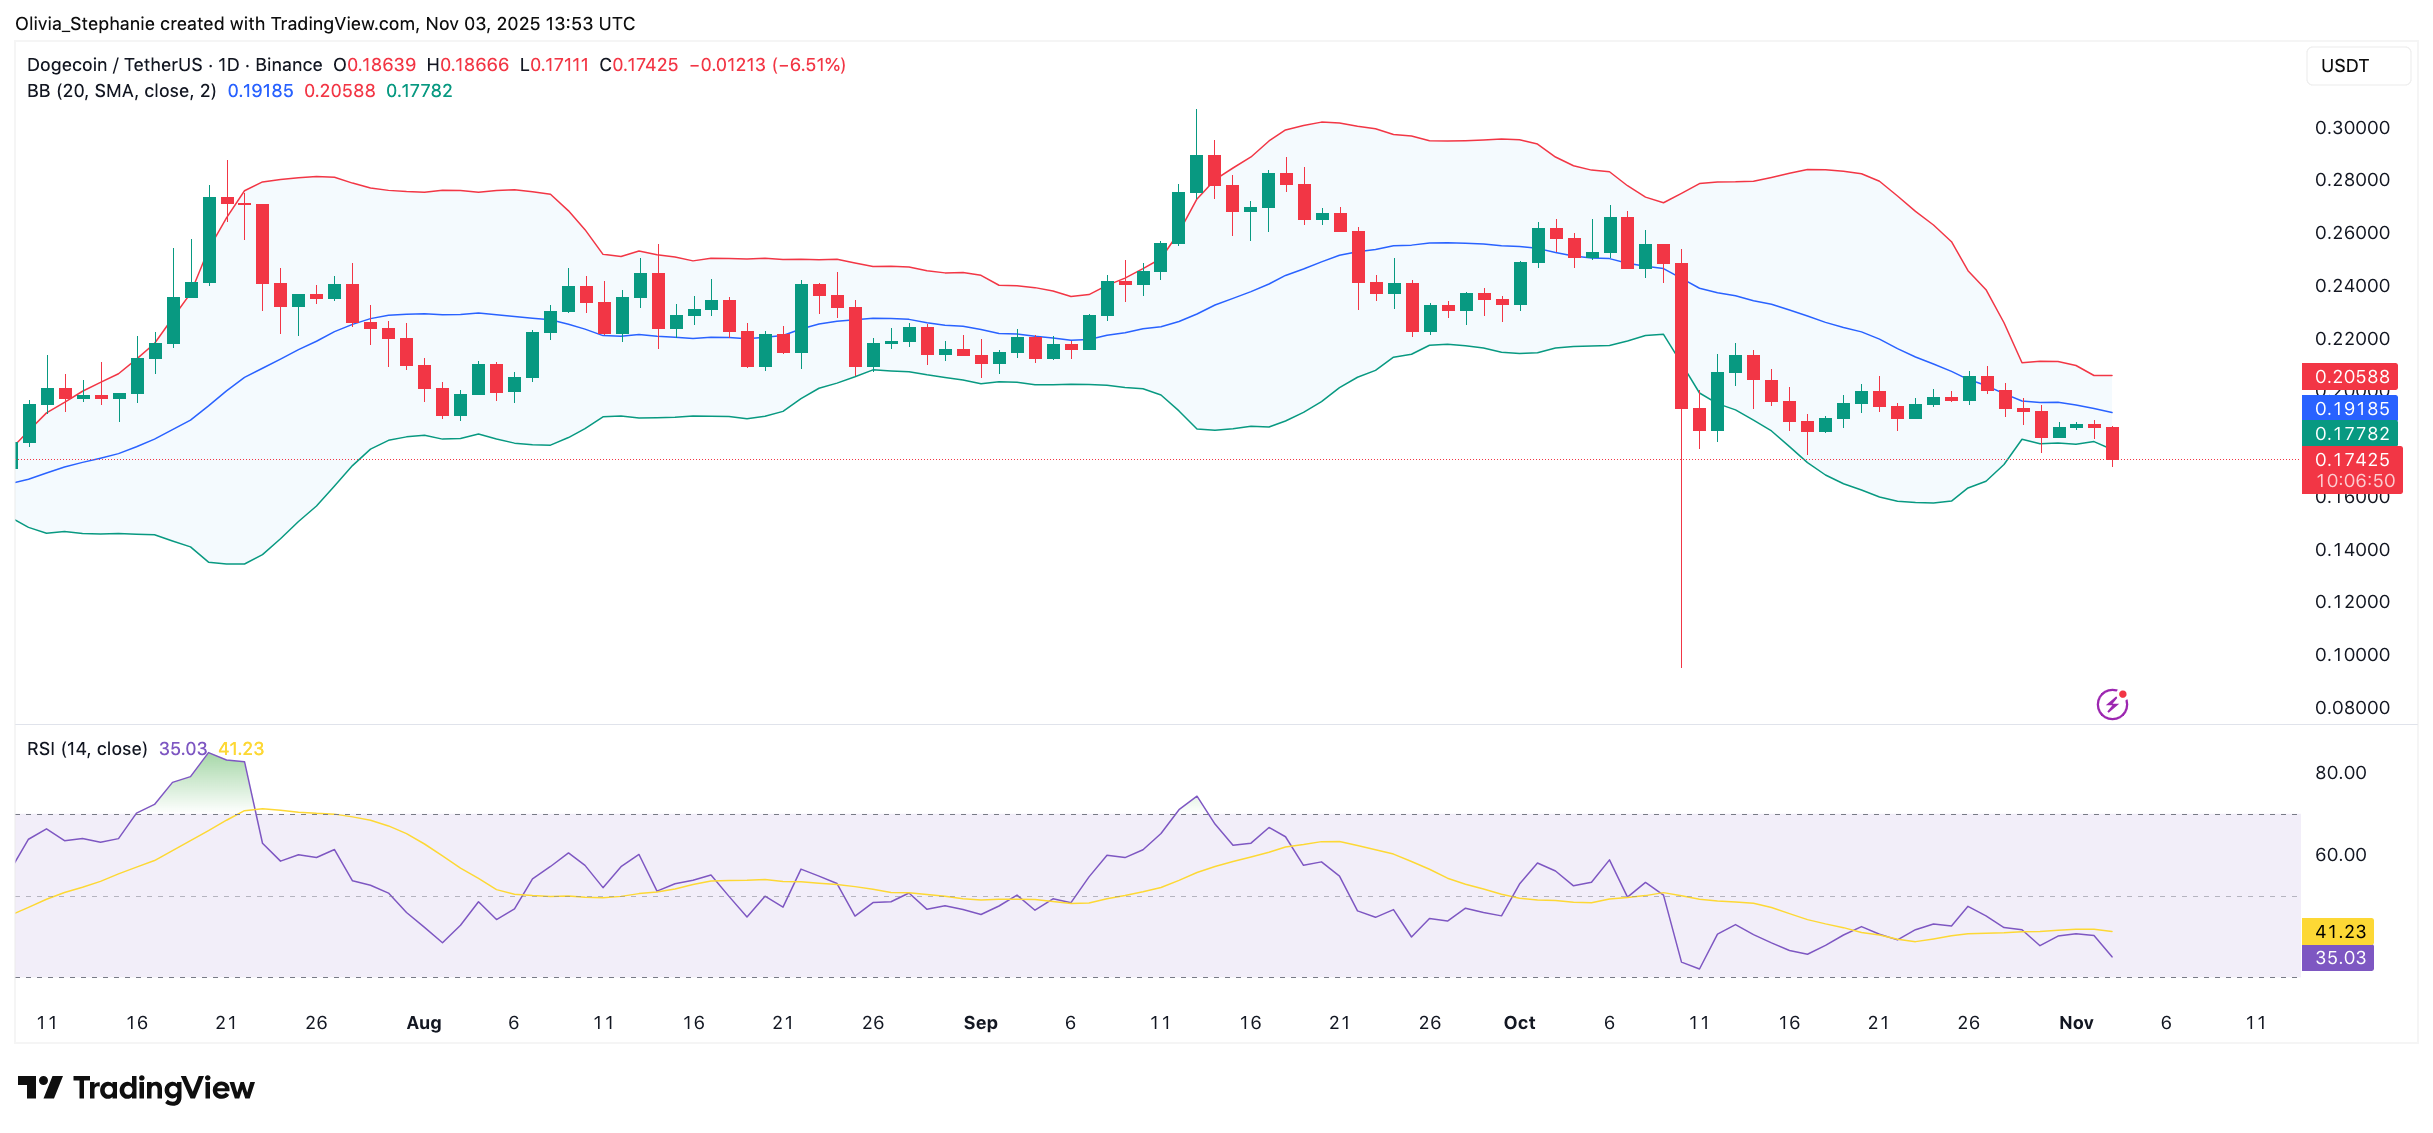
Meanwhile, Bollinger Bands show the price moving below the lower band, suggesting increased downside volatility or selling exhaustion. The 20-day moving average currently stands at $0.19185, which Dogecoin is trading well below.

- Source: TradingView
Crypto analyst Ali Martinez stated that $0.18 is a key support level. He referred to it as a “strong buy-the-dip zone” if the price holds. Since the asset is now under this level, its strength will be tested.
Whale Activity and Futures Market Show Cooling Interest
Wallets holding 10–100 million DOGE sold 440 million tokens over three days last week. This large-scale selling added to the recent price pressure and may have led smaller investors to follow.
Open interest in Dogecoin futures currently stands at $1.67 billion. This is far below its previous peak of over $6 billion. Lower open interest often reflects reduced trading activity and less leverage in the market. With both price and open interest moving lower, there is little sign of strong directional momentum for now.
SECRET PARTNERSHIP BONUS for CryptoPotato readers: Use this link to register and unlock $1,500 in exclusive BingX Exchange rewards (limited time offer).
Doge
Is Dogecoin (DOGE) in Buy-the-Dip Territory?
DOGE has remained sideways daily, but it’s down by almost 30% monthly. Following a bloody October, which failed to meet expectations for another bullish month, the OG meme coin is looking for a rebound in November, and one popular analyst believes there’s a lot of room for growth if the asset maintains above a particular…
DOGE has remained sideways daily, but it’s down by almost 30% monthly.
Following a bloody October, which failed to meet expectations for another bullish month, the OG meme coin is looking for a rebound in November, and one popular analyst believes there’s a lot of room for growth if the asset maintains above a particular area.
However, there are some warning signs on the DOGE horizon, such as whales disposing of large quantities of the asset.
$0.18 looks like a strong buy-the-dip zone for Dogecoin $DOGE before a potential run toward $0.26 or $0.33. pic.twitter.com/LltHHiRFMR
— Ali (@ali_charts) November 1, 2025
Ali Martinez has repeatedly outlined the significance of the $0.18 support. It doubled down earlier today, indicating that it could serve as a price propeller if DOGE remains above it and could actually be used as a “strong buy-the-dip zone.”
The analyst with over 161,000 followers on X predicted another price surge to $0.26 or even $0.33 if this support holds. It’s worth noting that DOGE exceeded the first target twice in September and October but hasn’t reached the second since January. Its latest rejection came during the October 10 bloodbath when it plunged from $0.23 to $0.15 within hours.
It has since maintained a value above $0.18, despite testing it on a couple of occasions. However, the resistance at $0.22 has capped its progress. What’s particularly worrisome about DOGE’s perspective is whales’ behavior.
These large market participants sold 440 million DOGE in just three days last week, intensifying the immediate selling pressure and potentially signaling market capitulation to smaller investors.
You may also like:
-
Dogecoin (DOGE) Rally Lacks Retail Mania – And That Might Be Bullish -
Major Crypto Unlock for this Week: SOL, AVAX, and DOGE Face $790M Supply Surge -
12 Best Meme Coins to Watch in July 2025
Dogecoin’s RSI, a metric showing the underlying asset’s overbought or oversold condition, doesn’t offer much insight into its next move. It’s currently at 46, which is essentially a neutral zone, without any significant indication of what’s to follow.
SECRET PARTNERSHIP BONUS for CryptoPotato readers: Use this link to register and unlock $1,500 in exclusive BingX Exchange rewards (limited time offer).
![]()
About the author

Jordan got into crypto in 2016 by trading and investing. He began writing about blockchain technology in 2017 and now serves as CryptoPotato’s Assistant Editor-in-Chief. He has managed numerous crypto-related projects and is passionate about all things blockchain.
-

 Bitcoin4 years ago
Digital Currency Group wraps up $600 million debt capital raise
-

 Bitcoin4 years ago
Salvadoran Ecologist Claims Nayib Bukele’s Volcano-Powered Bitcoin Mine Will End in Environmental Disaster’
-

 Bitcoin4 years ago
Astra Protocol provides identity protection for The Sandbox users
-

 NFT4 years ago
DRepublic launches a combined NFT platform, ‘MetaCore’ Using EIP-364
-

 Bitcoin4 years ago
Where to buy Dogelon Mars after falling 15% on Thursday
-

 Bitcoin4 years ago
Stella, a UAE Hospitality Brand, Now Accepts Crypto
-

 Ethereum4 years ago
Ethereum prices skyrocket but Ether Gas Fees surge, fueling costly transfers
-

 Bitcoin4 years ago
Are you a Star Atlas fan?